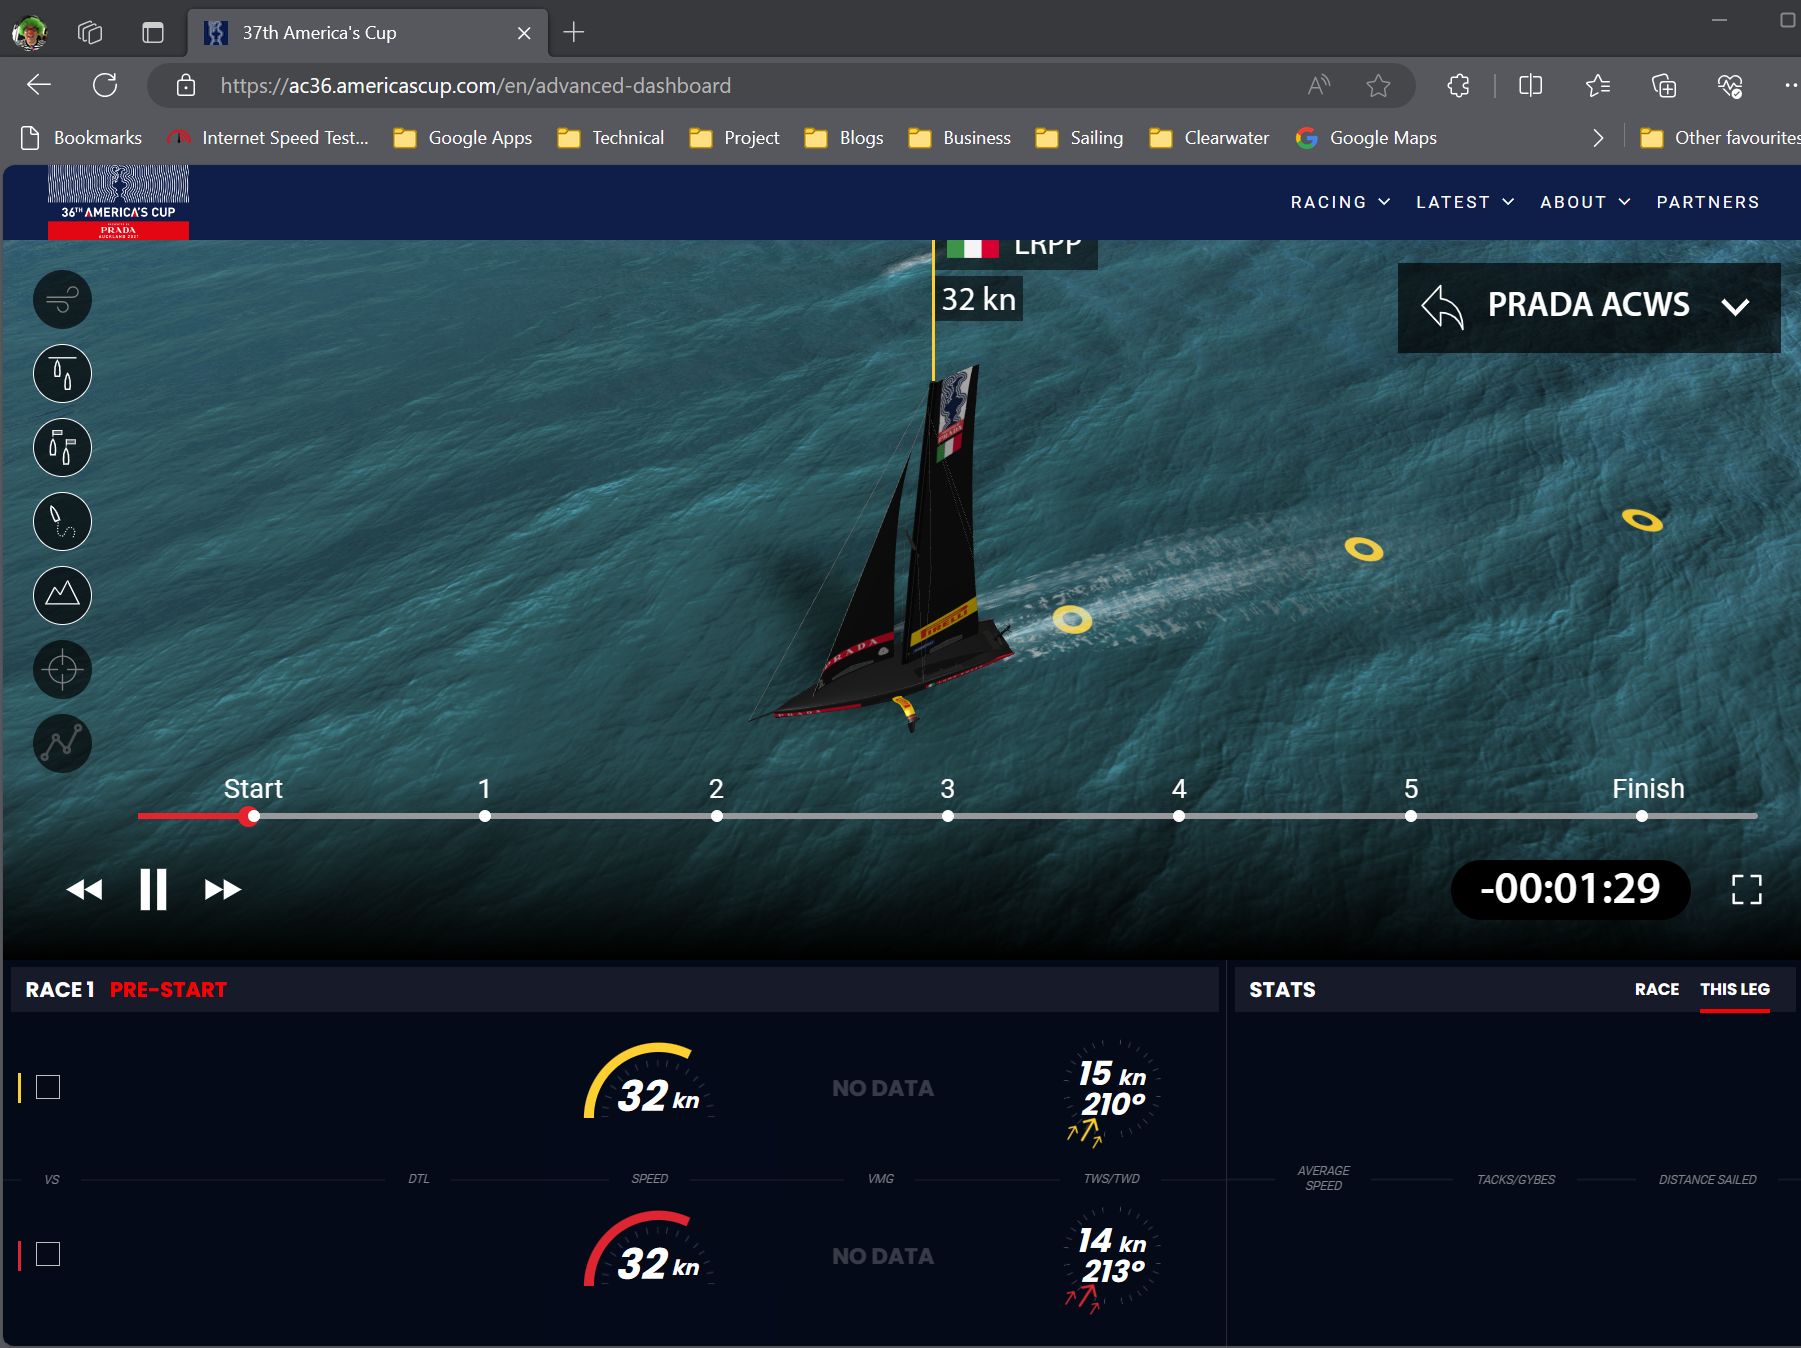
The Sport of Sailing has the usual types of championships; National, European, and World Championships, as well as a vast array of Regatta’s – Famous ones include Cowes and Antigua. The Championships are fought in boats that are identical, with very strict rules that boat owners must abide by. There can be hundreds of competitors, and boats can be relatively cheap (and some class of boat can be expensive!) which means the best sailors win, not the best boat. They need good skills, fitness, teamwork, and the right tactics.
However, there is one sailing competition in sailing that is unlike any other. The Americas Cup.
Here is what bing has to say about it: https://sl.bing.net/fBW1imgsoqy
Running since 1851, the Americas Cup sailing competition has always been at the pinnacle of Sailing, mainly because as a competition it far exceeds all others in terms of money spent!!
Its only between two boats, and there are rules on how how the boat is built, and tested and designed. This means its not just about the sailors and their skills, it about the wider team, designers, builders, logistics, and the sailors. In much the same way that Formula 1 is not just about the drivers, but the cars.
As with all technical development races, the development of the fastest boat is based on data, and the Americas cup teams are gathering data at a huge rate. Unfortunately I dont have access to that – they will guard that stuff very fiercely, but there is some information from the last Cup (AC36) that we can Analyse with our Oracle Analytics Cloud based Data Visualisation tooling.
Part 1 – Loading Data
The first stage in the analysis of the America’s cup data is to load it! I have dozens of csv files, but will load a few of them to see if I can find out why New Zealand won (Spoiler!). lets get stuck in…
Head to the datasets section of DV

Hit Create, and select Dataset

Select your file

The file is loaded, checked and fields defined (column types are automatically defined based on the vales found)

You can just accept the data types, because later when you analyse, you can change the type on the fly

We will actually do the conversion at the time of the import process to save time later.

You can select each column individually, here we have changed some columns to make them Attributes, not numbers.

You can also multi select the columns and many in one go.


Once you have defined your data file, just save it.

Part 2 – Initial Analysis
We are gong to investigate the data without any preconceived ideas, lets use the power of DV to try things out, and see where it leads us.
Lets make a workbook, and just add loads of analyses, some of which come from the Automatic Insights. I will start with the Italian boat data for Race 1.

Lets add some graph of our own, here i have placed boat speed over the whole race, and compared that with the average windspeed.

From the above it appears that the boat got quicker over the race, even though the wind speed remained constant. So if the wind was constant, then the sailors basically got better! SO the sailors skill IS a factor!
Lets add some Calculations of our own, to see if we can validate the above assumption

As you can see, we can create some bins for the race, in this case we are looking to show the race in four quarters. And it does show that average speed in the final quarter was better than Q1 and 2.
I will add another view to see if there is a particular direction the bait sails, to make it faster. Maybe the last quarter was dominated by downwind sailing (which is geneally faster).
The Polars are now added to the workbook

The above, on the face of it, seems to show some directions are faster than others, and that the boat got faster as the race went on.
We now need to dive further into the data, and start comparing with the New Zealand boat in race 1. The raw data we have includes sailing in straight lines, and turning (tacking and Gybing). We need to separate these, as well as split downwind vs upwind sailing. To do that we need some more columns, which we will generate using the data in the original file
So in the next part we will look into Data Flows, which will help us to Add fields, and join separate datasets.
to be continued…..
