Managing data in Oracle Analytics can be done in a variety of ways – So how do you know which is the best way?
Lets looks at the options
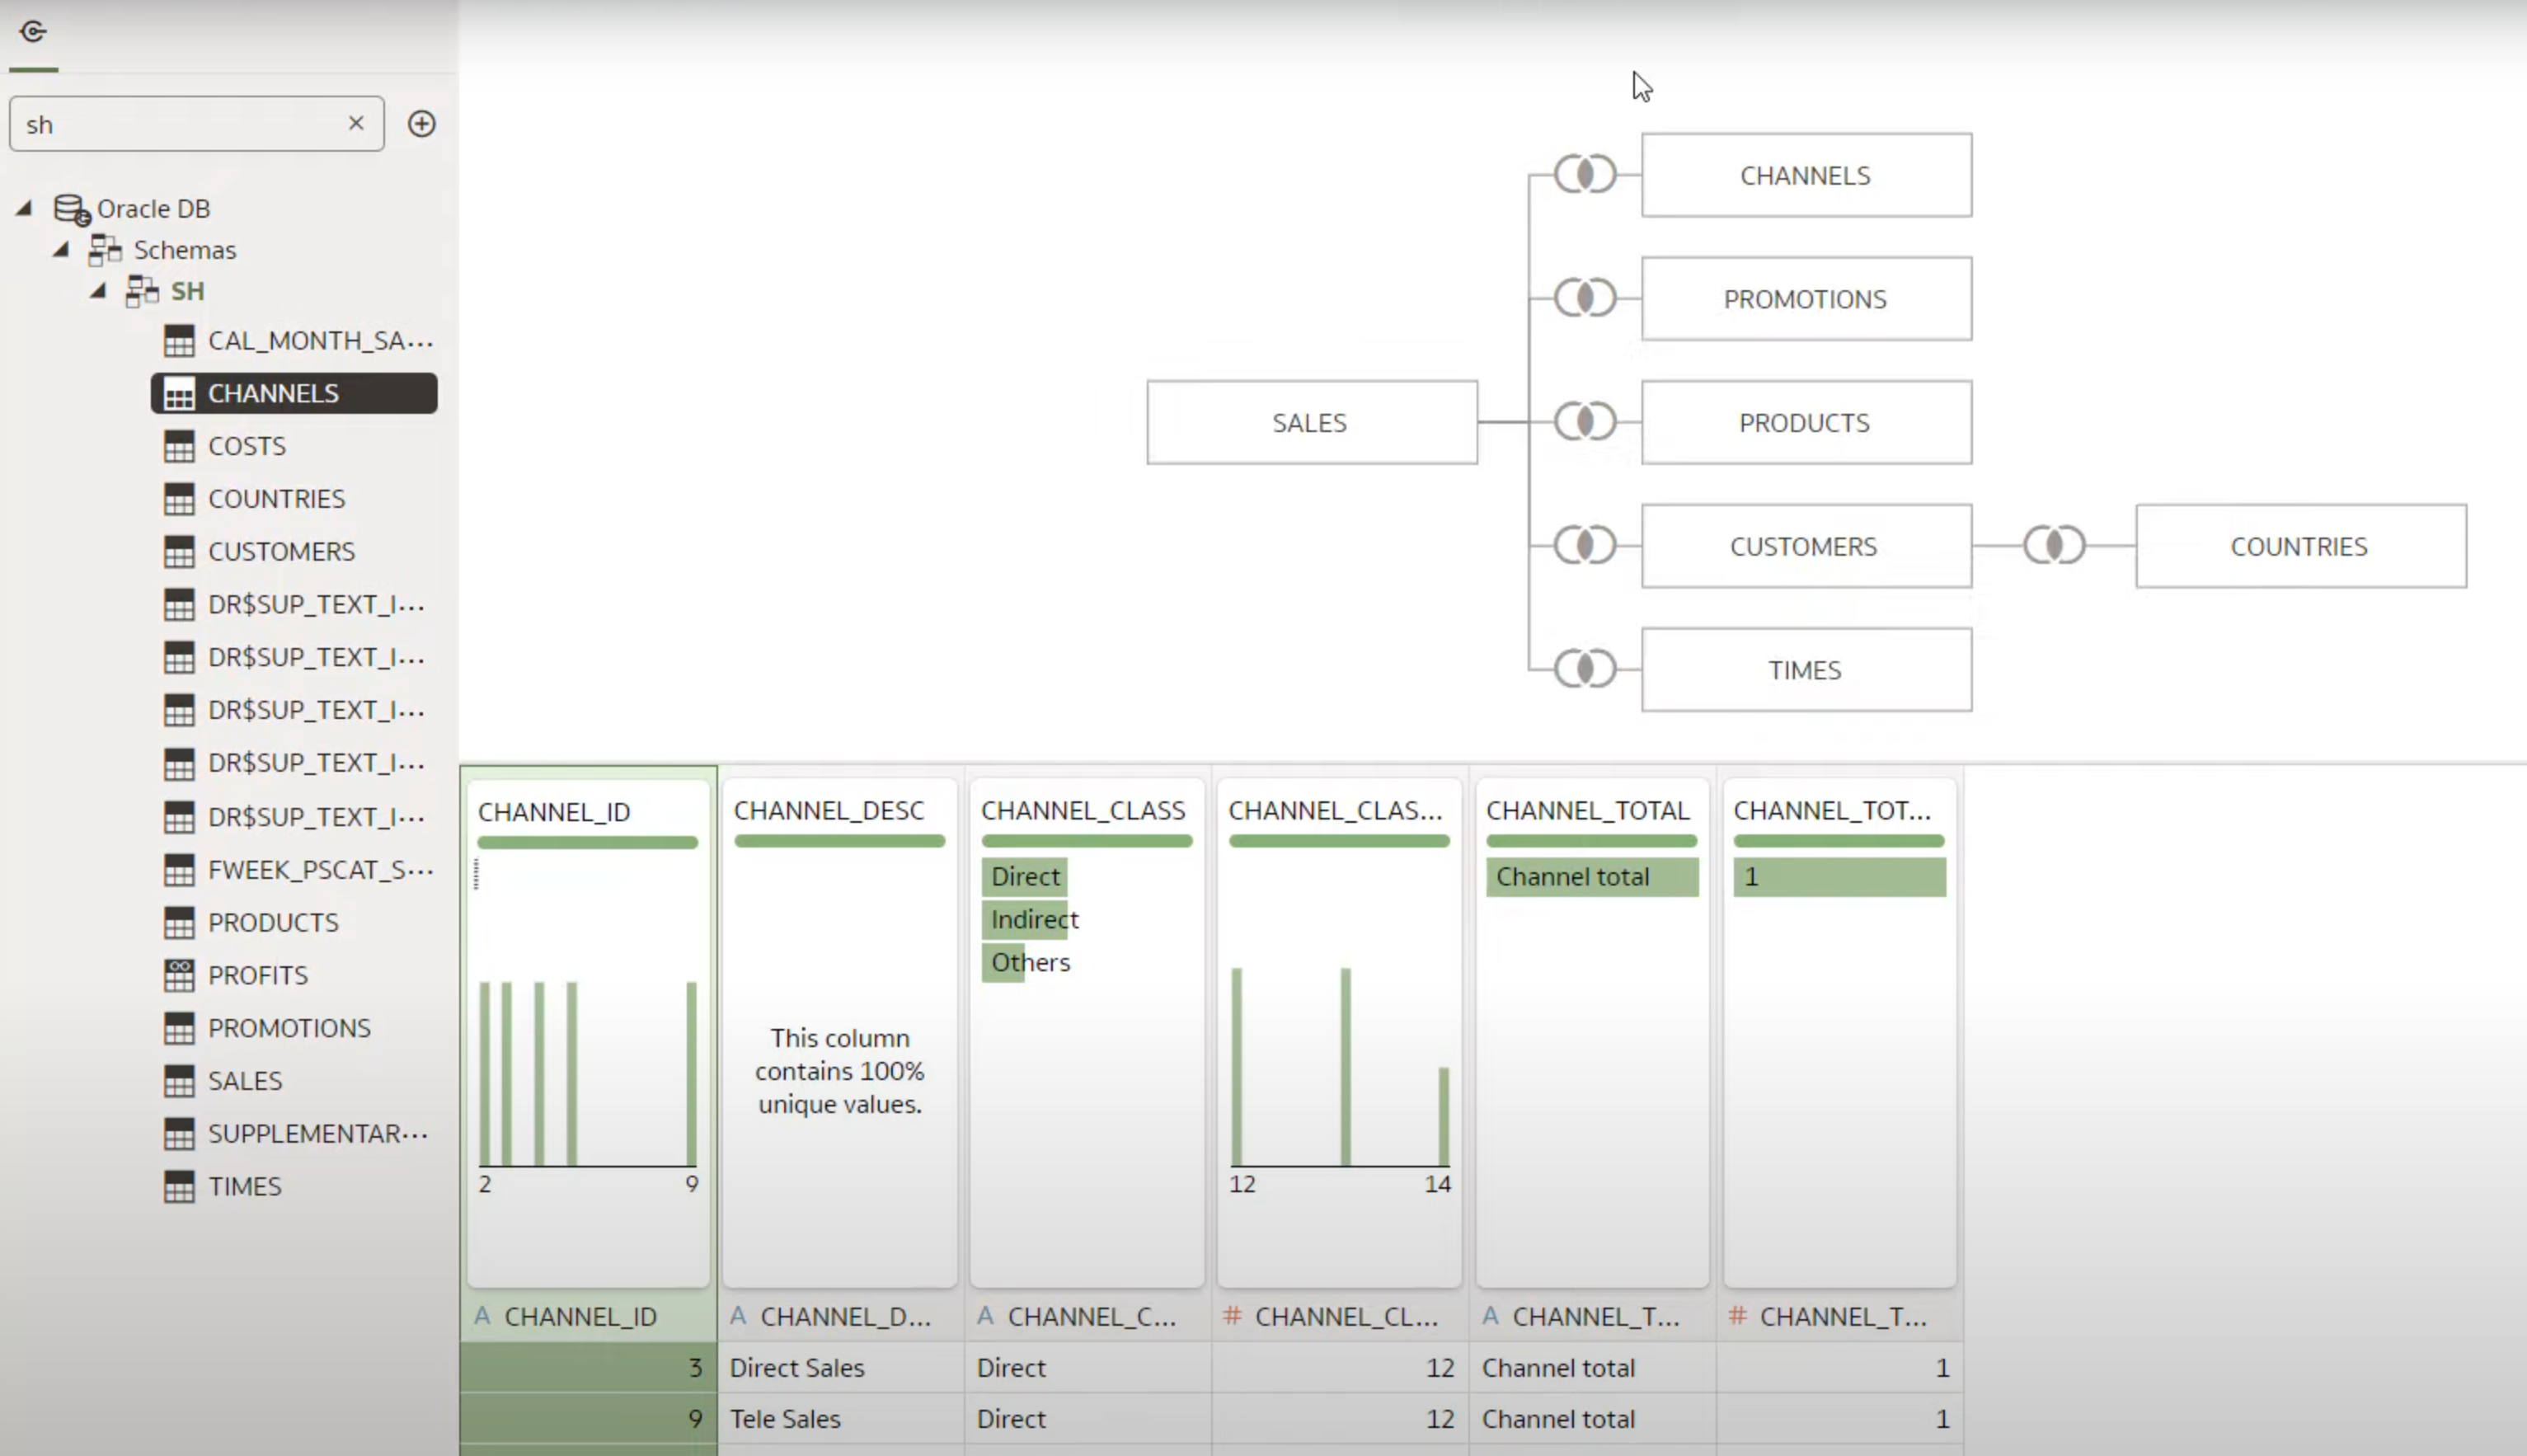
- Create Dataset from Database Tables
- Create single Table Dataset
- Create a single Datasets using Multiple Tables
- Upload Data using DV
- Upload Single File into a Dataset
- Upload Multiple Files in a single datasets
- Use Dataflows
- Combine multiple Datasets into a Single Datasets using a Dataflow
- Use Mutiple Datasets in a single workbook
Here’s a great video showing the muti table approach
So lets recap the simple file upload methods we can use to analyse Race data:

From our earlier post we saw how to upload a file. You can add columns and change column types during the upload and dataset creation.
There is actually a method to upload more than one file into a single dataset (Option 4 above). this method allows you to define the join for the data, and make both sets of columns available in the analysis. Much in the same way that the video highlighted above.

Thats is fine where you have a join, but our data is the same in each file, just for a different race, so there is no join

😒😒
Luckily, we can also create a dataset from a dataset, using a Data Flow. This gives us flexibility to separate the process, which enable analysis of the raw information, unchanged on input, and then analyse the transformed data. I find this useful for bug fixing, identifying where the problem sits.
We can also start to bring in more race data when using a 2-step process (Dataset then Dataflow) and importantly use the UNION step.
Adding Race 1 and Race together:

Above we can see that the two datasets can be placed into a union. However, we would not be able to distinguish between race 1 and 2 if we wanted to, so we add a column to each, before the Union:

You then get the added column in the entire new dataset

Note how the little diagram show the input steps “Add Columns”, you may want to make this more obvious what is going on by updating the step name:

The input now shows this:

We can now add columns to the unioned dataset

After we run the Data Flow, we should see a new dataset, with both races, and a additional columns for both races

And now all races can be analysed together, and compared, or we can see better averages over a bigger dataset.

And the the great thing is that we can start to add more races, without having to remember the formulas and positions of the calculated columns:
Upload the Race 3 csv file

Save the Dataset

Add it to the Data Flow

Add the Race Number Column

Add a union step
I choose to union race 2 and 3,

then union those to Race 1

Lets run the Dataflow and see what we get…

Our Third Race data arrived, and our analysis is going to better for it!
And now we start to ask ourselves, how far can this go?


In summary, we can bring lots of files into DV, and combine them using UNION or Joins. Union the similar data, and join the related data
So after 4 races, can we see any patterns emerging, and what about that speed comparision we saw last time?

Wow, its pretty consistent, Upwind boat speed on Port is always faster than on Starboard, and Downwind on Starboard is faster than downwind on Port. Cant see that, try some heatmap

The darker the colour the higher the value, but given that the wind strength varied, the heatmap can be a little hard to read!
